Market Maker Leaderboard Documentation
Required Context for Readers: This document serves as the central repository for official documentation of Forgd's Market Maker Leaderboard. The content of this document is organized by the five pages of the Market Maker Leaderboard: Performance Index, Depth Leaderboard, Volume Leaderboard, Spread Leaderboard, and KPI Adherence Leaderboard in addition to a Preface section to provide a necessary overview of the aforementioned pages before readers dive in.
1. Preface & Market Maker Leaderboard Overview
Forgd's Market Maker Leaderboard provides data-driven insights on 40+ institutional liquidity providers across key performance metrics to measure top-of-book spreads, depth of liquidity, fill order volume and KPI adherence. These metrics are calculated and updated on a daily basis across hundreds of engagements for live token projects that utilize Forgd to monitor Market Maker trade activity via our free-to-use dashboards. There are five distinct leaderboards: Performance Index, Depth Leaderboard, Volume Leaderboard, Spread Leaderboard, and KPI Adherence Leaderboard. A high level description of each can be found below:
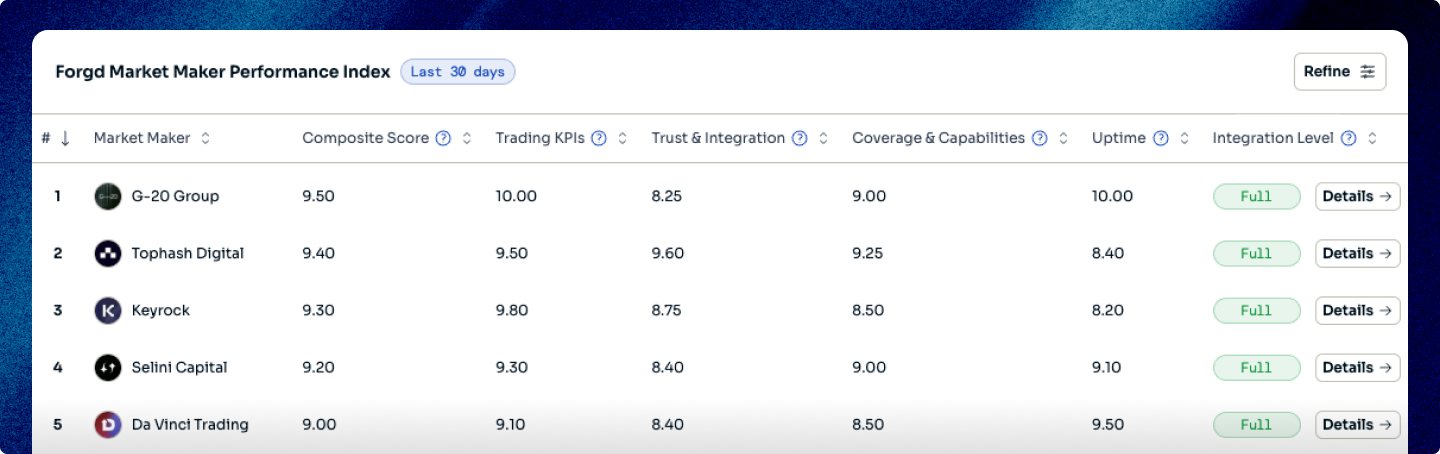
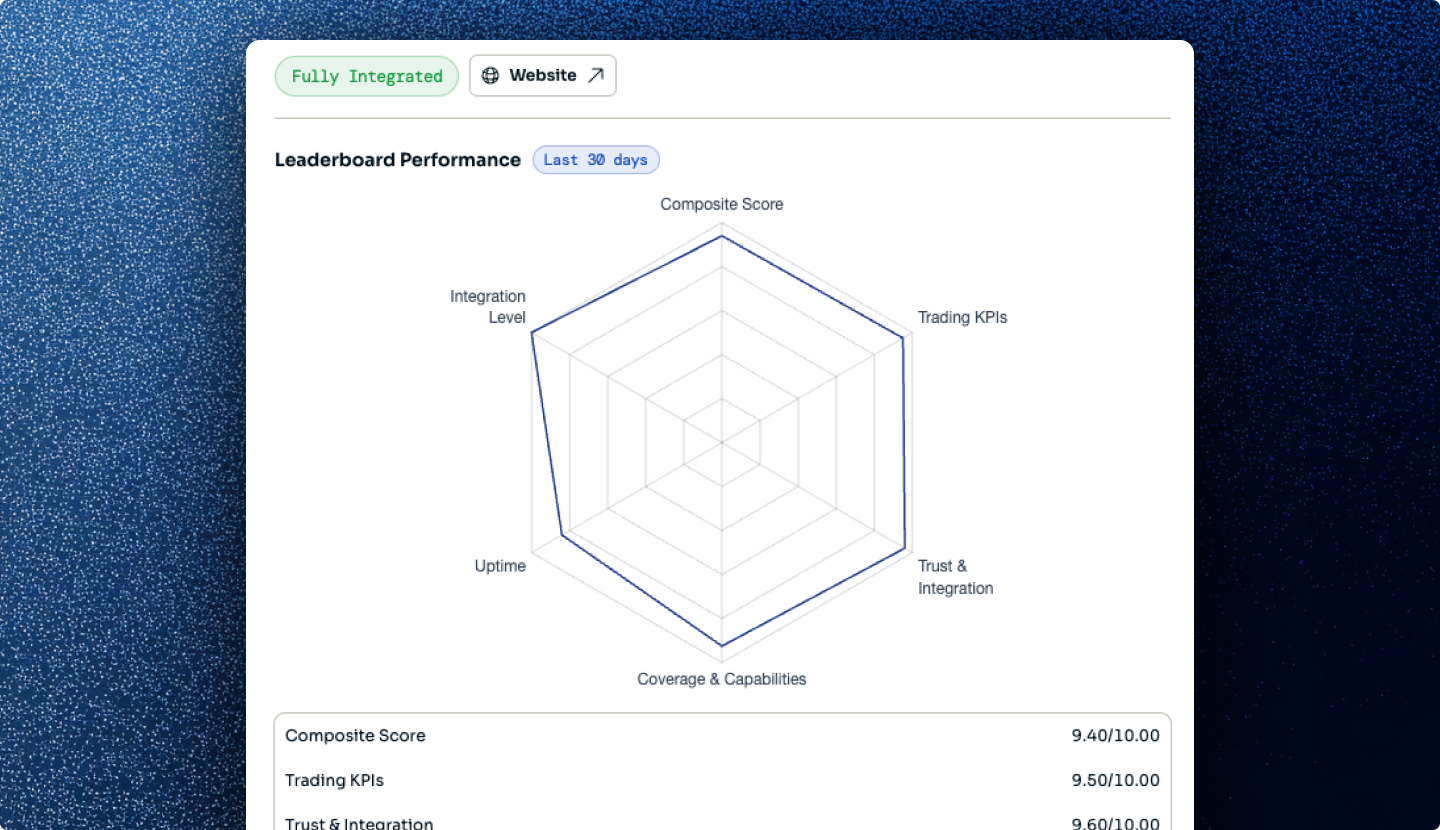
- The Performance Index shows market maker ranks across all key performance metrics with additional information regarding their integration level with Forgd, their trading coverage & capabilities, and ancillary information (exchange coverage, non-market making services, active engagements shared with Forgd, and more). This allows Forgd to calculate a proprietary composite score derived from 50+ quantitative and qualitative variables.
- The Depth Leaderboard displays the average depth of liquidity for each market maker across +/- 0.50%, +/- 1.00%, & +/- 2.00% for all of their respective active engagements being tracked by Forgd. Both the average notional depth and the average percentage of all depth is provided on a per market maker basis. Additionally, the average depth loan utilization is calculated for each market maker.
- The Volume Leaderboard provides insights to the average maker fill order volume, the average taker fill order volume, the average total fill order volume (maker + taker), and the average volume loan utilization for each market maker across all of their active engagements that Forgd tracks.
- The Spread Leaderboard shows the average volume-weighted bid-ask spread across each market maker's active engagements. By using the volume-weighted bid-ask spread, we account for the notional size of orders at the best bid and the best ask, providing a more accurate reflection of implied transaction costs.
- The KPI Adherence Leaderboard tracks the uptime of market makers across their active engagements using industry standard KPIs (depth +/- 0.50%, +/- 1.00%, & +/- 2.00%, and top-of-book spreads). This measures the consistency with which market makers meet predefined performance thresholds, calculated as the proportion of successful KPI outcomes over time using a daily binary pass/fail framework.
Each leaderboard is further outlined in the documentation that follows with details on the significance of each, the calculation methodologies and how to navigate the various filter views. Project founders, advisors, investors and researchers can use the Market Maker Leaderboards to inform their decision around the right engagement structure or partner to align with for their token.
2. Performance Index
Overview
The Performance Index ranks market makers based on a proprietary composite score derived from 50+ quantitative and qualitative variables across their tracked engagements. It provides a unified view of overall performance by aggregating granular trading KPIs, including liquidity provision, execution quality, and operational consistency, alongside infrastructure, integration, and coverage-related attributes such as exchange integrations, API capabilities, and participation across CEXs, DEXs, and ancillary trading functions.
Calculation Methodology
"Grades" assigned to each Market Maker in the Performance Index are calculated using a proprietary weighted composite model that incorporates over 50 underlying KPIs. These KPIs are measured at a granular level and may differentiate across specific dimensions (e.g., depth at varying thresholds, bid vs. ask side behavior, and execution characteristics).
Each KPI contributes to the composite score with its own weighting, reflecting its relative importance within the overall evaluation framework. In addition to quantitative trading metrics, select infrastructure and capability-based attributes, such as integrations, API support, and trading coverage, are also incorporated into the composite calculation. The global weights of each metric are as follows:
| Metric | Weighting |
|---|---|
| Trading KPIs | 40% |
| Trust | 20% |
| Coverage & Capabilities | 15% |
| Uptime | 10% |
| Integration Level | 15% |
Each Market Maker's weighted score creates a "Composite Score", that ranges 1 - 10, with 10 representing the highest possible Composite Score, and 1 representing the lowest. Composite Scores are then used to assign a letter grade to provide a simplified interpretation of overall performance. Composite Scores align to Grades using predefined ranges and serve as shorthand for comparing market makers with similar overall performance profiles. The exact methodology for each grade can be found below:
| Composite Score | Grade | Interpretation |
|---|---|---|
| 9.0 – 10.0 | A+ | Best-in-class market maker with exceptional historical trading KPIs across depth, volume, spreads, and KPI adherence. Demonstrates strong trust signals, broad exchange and ecosystem coverage, high uptime, and deep integration with the Forgd platform. |
| 7.5 – 9.0 | A | Highly reliable, institution-grade market maker with strong performance across core trading KPIs and consistent execution across tracked engagements. Shows meaningful trust, broad capabilities, strong uptime, and a well-established integration profile with Forgd. |
| 6.0 – 7.5 | B | Generally strong provider with solid trading performance, though there may be some variability across depth, volume, spreads, KPI adherence, or coverage. Suitable for many engagements, with credible trust signals and capabilities but room for improvement in consistency, breadth, or integration. |
| 5.0 – 6.0 | C | Usable counterparty with demonstrated capabilities, but with more noticeable limitations across trading KPIs, exchange coverage, uptime, trust signals, or Forgd integration. Best suited for narrower mandates where the market maker's strengths align closely with the project's specific liquidity needs. |
| <5.0 | D | Limited information is currently available on this market maker due to lower visibility or limited integration with Forgd. Projects should engage the counterparty directly, request additional materials, and conduct appropriate diligence before relying on the provider for key liquidity mandates. |
Grades provide a more intuitive representation of overall performance. While the Composite Score offers greater precision, the letter grade groups market makers into broad performance tiers, making it easier to benchmark counterparties at a glance. Because grades are derived solely from the Composite Score, changes in grade occur only when a market maker's composite score crosses a defined threshold. Each of the underlying metrics used to calculate Composite Scores are described below.
Trading KPIs
The Trading KPI component evaluates a market maker's performance across four core dimensions: liquidity depth, execution quality, capital efficiency, and operational reliability. Depth is measured at +/- 0.50%, +/- 1.00%, & +/- 2.00% in both USD and % of market, with a bias toward bid-side liquidity. Execution quality is captured through maker and taker volume, with greater emphasis on passive (maker) activity, while loan utilization measures how efficiently capital is deployed. Uptime and bid-ask spread reflect consistency and quote competitiveness. The weightings and rankings of all Trading KPIs are below:
| Metric | Weighting | Ranking |
|---|---|---|
| Bid Depth 100 bps, USD Value | 12.50% | 1 |
| Maker Fill Volume, USD Value | 10.25% | 2 |
| Combined Uptime % | 10.00% | 3 |
| Uptime %, Bid & Ask Depth 200 bps | 8.00% | 4 |
| Bid & Ask Spread (%) | 7.00% | 5 |
| Bid Depth 200 bps, USD Value | 5.00% | 6 |
| Bid Depth 200 bps, % of Market | 5.00% | 7 |
| Maker Fill Volume, % of Market | 5.00% | 8 |
| Number of Projects | 5.00% | 9 |
| Uptime %, Bid & Ask Depth 100 bps | 4.00% | 10 |
| Bid Depth 50 bps, USD Value | 2.50% | 11 |
| Ask Depth 100 bps, USD Value | 2.50% | 12 |
| Bid Depth 100 bps, % of Market | 2.50% | 13 |
| Loan Utilization, Maker Fill Volume | 2.50% | 14 |
| Uptime %, Bid-Ask Spread | 2.50% | 15 |
| Uptime %, Bid & Ask Depth 50 bps | 2.00% | 16 |
| Ask Depth 200 bps, USD Value | 2.00% | 17 |
| Ask Depth 200 bps, % of Market | 2.00% | 18 |
| Loan Utilization, Bid & Ask Depth 200 bps | 2.00% | 19 |
| Taker Fill Volume, USD Value | 1.50% | 20 |
| Bid Depth 50 bps, % of Market | 1.25% | 21 |
| Ask Depth 100 bps, % of Market | 1.00% | 22 |
| Loan Utilization, Bid & Ask Depth 100 bps | 1.00% | 23 |
| Taker Fill Volume, % of Market | 1.00% | 24 |
| Ask Depth 50 bps, USD Value | 0.50% | 25 |
| Ask Depth 50 bps, % of Market | 0.50% | 26 |
| Loan Utilization, Bid & Ask Depth 50 bps | 0.50% | 27 |
| Loan Utilization, Taker Fill Volume | 0.50% | 28 |
All values are aggregated across each market maker's active engagements tracked by Forgd and are recalculated dynamically based on the selected timeframe.
Trust
The Trust component evaluates the level of confidence Forgd can place in a market maker's observed performance. This is primarily informed by the number of engagements tracked through Forgd for that market maker. A larger sample size of tracked engagements provides greater visibility into the market maker's performance across different projects, market environments, and execution requirements. For example, market makers with more than 20 tracked engagements may receive the maximum score for this component, while market makers with fewer than five tracked engagements may receive a lower score due to the limited available sample size.
Trust also accounts for potential trading abnormalities identified through Forgd's monitoring systems. These may include, but are not limited to, indications of potential spoofing, unusual discrepancies between quoted liquidity and actual filled maker volume, or skewed fill patterns across engagements (e.g., high maker fill volume with no taker fill volume indicating a lack of rebalancing or hedging from tracked accounts). In general, market makers with a larger number of tracked engagements and fewer observed trading abnormalities receive a higher Trust score, as this serves as a proxy for both sample-size confidence and consistency of execution quality.
Coverage and Capabilities
The Coverage and Capabilities component reflects the breadth of a market maker's exchange coverage, ecosystem reach, and service offering. Market makers with strong connectivity across major centralized exchanges, as well as meaningful integrations across leading decentralized exchanges and multiple base-layer ecosystems, receive a higher score. This category is intended to measure not only where a market maker can operate, but also the depth and flexibility of its execution infrastructure.
This component also considers ancillary services offered beyond standard liquidity provision. These may include treasury management, OTC execution, covered call strategies, zero-cost collars, liquidation support, exchange listing introductions, and advisory support related to exchange applications or go-to-market planning. Market makers with broader capabilities are generally better positioned to support blockchain projects across a wider range of market conditions and strategic objectives.
Uptime
The Uptime component measures a market maker's operational consistency across tracked engagements. Uptime is synonymous with KPI adherence. For context, most market making agreements include contractual obligations to maintain specific levels of depth, spread, and availability across designated centralized or decentralized exchanges. KPI adherence is measured on a per engagement basis and then averaged across all engagements tracked from the Market Maker. Market makers that consistently satisfy contractual obligations across their engagements receive a higher Uptime score.
Conversely, market makers that frequently fall short of agreed-upon depth, spread, or availability requirements may receive a lower Uptime score. This category is intended to help projects understand whether a market maker has historically demonstrated reliable execution and consistent performance against its contractual obligations.
Integration Level
The Integration Level component reflects the degree to which a market maker is connected to Forgd's data consumption and monitoring systems. Market makers with full API integrations across multiple engagement types, active participation in RFQs, and consistent data connectivity receive the highest Integration Level scores. This level of integration enables Forgd to evaluate performance with greater accuracy and provides projects with stronger visibility into the market maker's execution history.
Market makers with less sophisticated data connectivity, limited engagement tracking, or no RFQ participation may receive a partial Integration Level score. Market makers that are not yet integrated with Forgd are not eligible to receive a score in this category, as Forgd has limited visibility into their capabilities and current project engagements. For the avoidance of doubt, integration with Forgd is free and available to all market makers. Any market maker with a lower Integration Level score can improve its ranking by integrating with Forgd's systems and increasing the transparency of its tracked activity.
How to Interpret
The composite score represents a relative measure of overall performance across all included dimensions. Higher-ranked market makers have demonstrated stronger aggregate performance across the full set of evaluated KPIs and attributes within the selected timeframe. Supporting columns should be used to contextualize the composite score. For example:
- Trading KPIs benchmark market makers' raw performance against one another.
- Trust is measured based on the number of engagements tracked and instances of trading abnormalities from tracked engagements.
- Coverage & Capabilities reflects the breadth of trading coverage across CEXs & DEXs as well as additional trading functions.
- Uptime indicates operational consistency over the selected period.
- Integration Level reflects the degree of integration with Forgd's data consumption systems.
Market makers may share the same rank in cases where composite scores are equivalent when rounded to one decimal place.
Filtering
Timeframe filtering can be configured under the "Refine" button at the top right of the table. All Performance Index values, including the composite score, rankings, and supporting metrics, are recalculated dynamically based on the selected timeframe.
3. Depth Leaderboard
Overview
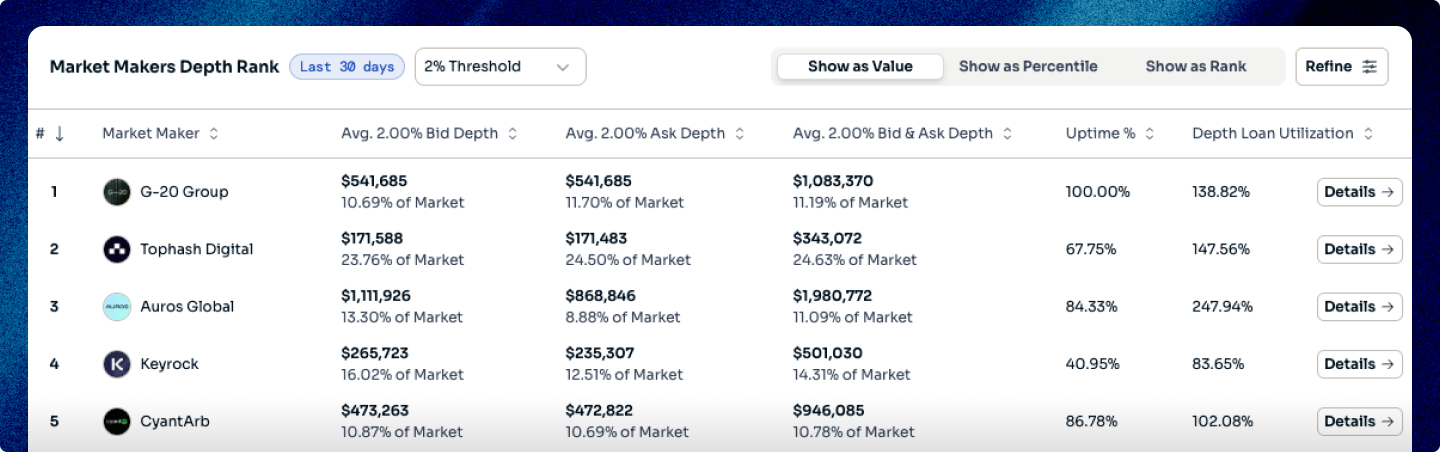
The Depth Leaderboard ranks market makers based on the liquidity they provide within defined thresholds around the mid-point, offering a comparative view of resting bid and ask depth across their tracked engagements. It measures average notional liquidity within +/- 0.50%, +/- 1.00%, & +/- 2.00% price bands, representing progressively wider segments of the order book. In addition to notional depth, the leaderboard includes each market maker's percentage share of total depth within the selected threshold, providing a normalized view of relative liquidity contribution, as well as Depth Loan Utilization, which measures the extent to which loaned inventory is used to support quoted depth.
Calculation Methodology
Average notional depth is calculated by measuring the total resting bid and ask liquidity within the selected price thresholds (+/- 0.50%, +/- 1.00%, & +/- 2.00%) and averaging these values across all tracked engagements for each market maker over the selected timeframe.
- % of Total Depth is calculated as each market maker's average share of aggregate depth across all resting bids and offers within the selected threshold, relative to the total depth provided by all market makers.
- Depth Loan Utilization is calculated as the ratio of loaned inventory utilized to support quoted depth relative to the total average depth provided. Values exceeding 100% indicate that quoted depth exceeds the amount of loaned inventory and should be interpreted with caution.
The table below outlines the underlying metrics used to rank market makers on the Depth Leaderboard, including their respective weightings and relative importance. These metrics primarily capture liquidity provision across defined thresholds around the mid-point, with emphasis on bid-side depth, project count, and overall market share.
| Metric | Weighting | Ranking |
|---|---|---|
| Bid Depth 200 bps, USD Value | 11.00% | 1 |
| Number of Projects | 9.25% | 2 |
| Loan Utilization, Bid & Ask Depth 200 bps | 7.75% | 3 |
| Uptime %, Bid & Ask Depth 200 bps | 7.50% | 4 |
| Bid & Ask Depth 200 bps, USD Value | 7.00% | 5 |
| Bid Depth 200 bps, % of Market | 7.00% | 6 |
| Ask Depth 200 bps, USD Value | 6.00% | 7 |
| Bid Depth 100 bps, USD Value | 5.00% | 8 |
| Bid & Ask Depth 200 bps, % of Market | 4.25% | 9 |
| Bid Depth 100 bps, % of Market | 4.00% | 10 |
| Ask Depth 200 bps, % of Market | 4.00% | 11 |
| Uptime %, Bid & Ask Depth 100 bps | 3.50% | 12 |
| Bid & Ask Depth 100 bps, USD Value | 3.00% | 13 |
| Ask Depth 100 bps, USD Value | 2.50% | 14 |
| Bid Depth 50 bps, USD Value | 2.50% | 15 |
| Loan Utilization, Bid & Ask Depth 100 bps | 2.50% | 16 |
| Bid & Ask Depth 100 bps, % of Market | 2.00% | 17 |
| Ask Depth 100 bps, % of Market | 2.00% | 18 |
| Bid Depth 50 bps, % of Market | 2.00% | 19 |
| Uptime %, Bid & Ask Depth 50 bps | 1.50% | 20 |
| Bid & Ask Depth 50 bps, USD Value | 1.50% | 21 |
| Loan Utilization, Bid & Ask Depth 50 bps | 1.25% | 22 |
| Ask Depth 50 bps, USD Value | 1.00% | 23 |
| Bid & Ask Depth 50 bps, % of Market | 1.00% | 24 |
| Ask Depth 50 bps, % of Market | 1.00% | 25 |
How to Interpret
Higher notional depth indicates that a market maker is consistently providing larger amounts of liquidity within the selected price thresholds. Depth closer to the mid-point (e.g., +/- 0.50%) reflects tighter and more immediately accessible liquidity, while wider thresholds (e.g., +/- 2.00%) capture broader order book support.
% of Total Depth provides context on relative market presence. A higher percentage indicates that a market maker contributes a larger share of overall liquidity within the selected threshold across all tracked engagements.
Depth Loan Utilization reflects how efficiently loaned inventory is being deployed to support liquidity. Higher utilization generally indicates more active use of inventory, while values exceeding 100% may indicate reliance on additional inventory sources or elevated quoting relative to loan size.
Filtering
By default, the Depth Leaderboard displays average notional values. Users can switch between notional values, percentile rankings, and absolute rank positions. Depth thresholds (+/- 0.50%, +/- 1.00%, & +/- 2.00%) can be selected to filter the displayed data across all market makers.
Timeframe filtering can be configured under the "Refine" button at the top right of the table. All depth metrics are recalculated dynamically based on the selected timeframe.
4. Volume Leaderboard
Overview
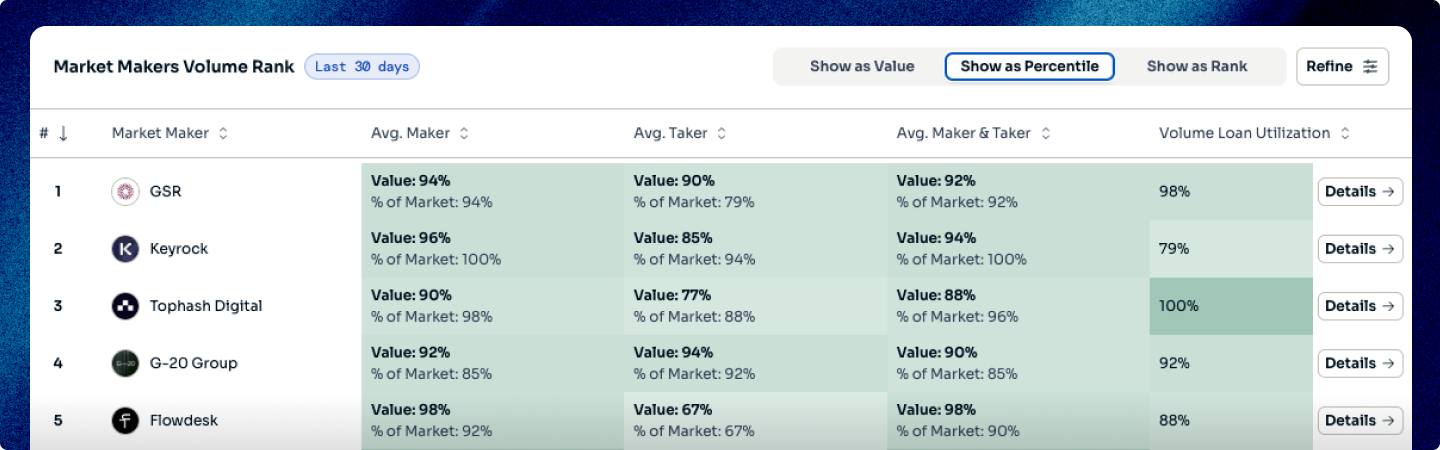
The Volume Leaderboard ranks market makers based on the trading activity they generate across their tracked engagements, providing a comparative view of executed volume segmented by maker and taker activity. It measures average maker fill volume (passive liquidity provision), taker fill volume (active liquidity taking), and total executed volume, allowing users to assess how market makers participate in trading flows. The leaderboard also includes Volume Loan Utilization, which measures the relationship between executed trading activity and the amount of loaned inventory, providing additional context on inventory turnover relative to trading activity.
Calculation Methodology
Average Maker Fill Volume and Average Taker Fill Volume are calculated by measuring executed trading volume attributable to each activity type and averaging these values across all tracked engagements for each market maker over the selected timeframe.
- Average Total Volume is calculated as the sum of maker and taker fill volumes.
- Volume Loan Utilization is calculated as the average total executed volume per period divided by the amount of loaned inventory. This reflects the level of trading activity generated relative to available inventory.
The table below details how market makers are evaluated on the Volume Leaderboard, including the weighting of each underlying metric. The framework is centered on passive trading activity, with greater emphasis placed on maker fill volume and overall participation in market turnover.
| Metric | Weighting | Ranking |
|---|---|---|
| Maker Fill Volume, USD Value | 30.00% | 1 |
| Maker Fill Volume, % of Market | 22.00% | 2 |
| Total Fill Volume, USD Value | 11.00% | 3 |
| Number of Projects | 10.00% | 4 |
| Loan Utilization, Maker Fill Volume | 8.00% | 5 |
| Taker Fill Volume, USD Value | 7.00% | 6 |
| Total Fill Volume, % of Market | 5.00% | 7 |
| Taker Fill Volume, % of Market | 3.00% | 8 |
| Loan Utilization, Taker Fill Volume | 2.50% | 9 |
| Volume Loan Utilization | 1.50% | 10 |
How to Interpret
Higher total volume indicates greater overall participation in trading activity across tracked engagements.
- Maker Fill Volume reflects passive execution, where trades occur against resting liquidity provided by the market maker.
- Taker Fill Volume reflects active execution, where the market maker is crossing the spread to trade against existing liquidity.
The relationship between maker and taker volume provides additional context on how trading activity is generated, though all components contribute to total volume.
Volume Loan Utilization reflects how actively loaned inventory is used to generate trading activity. Higher utilization indicates greater turnover relative to inventory size.
Filtering
By default, the Volume Leaderboard displays average notional values. Users can switch between notional values, percentile rankings, and absolute rank positions.
Timeframe filtering can be configured under the "Refine" button at the top right of the table. All volume metrics are recalculated dynamically based on the selected timeframe.
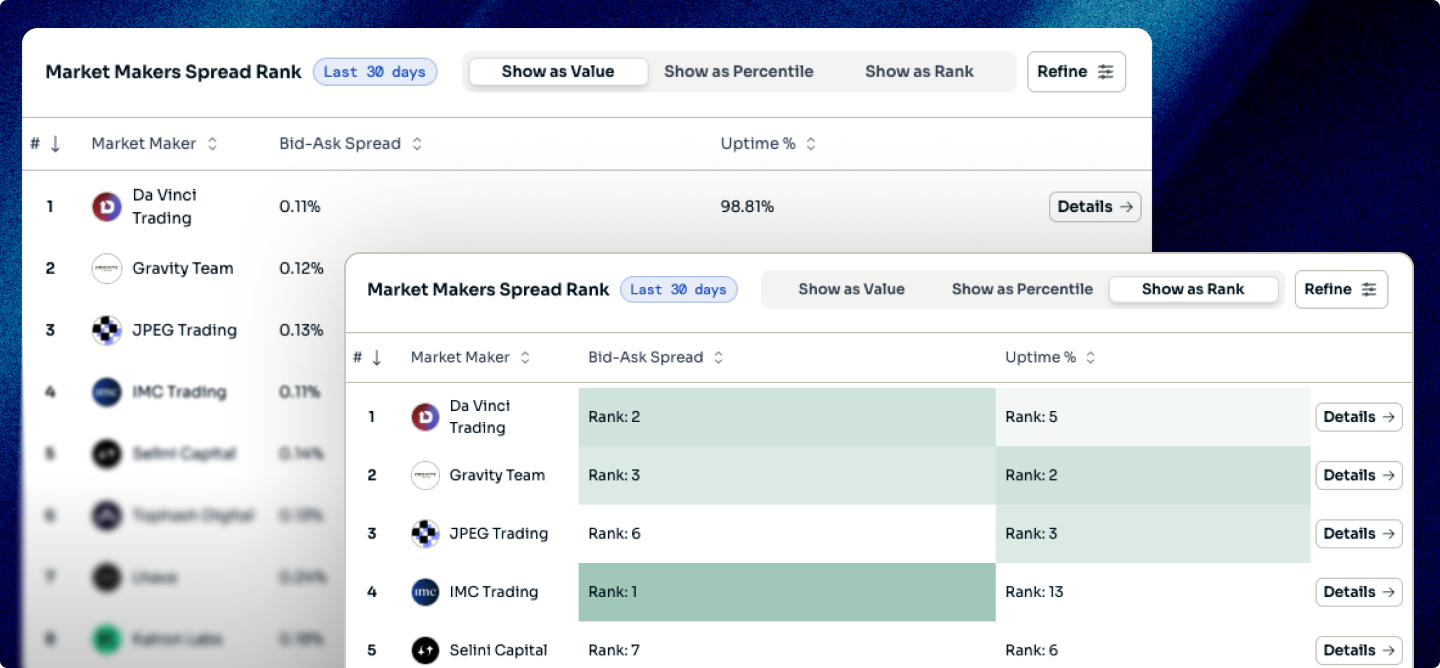
5. Spread Leaderboard
Overview
The Spread Leaderboard ranks market makers based on the tightness of their quoted bid-ask spreads across their tracked engagements, providing a comparative view of pricing efficiency around the mid-point. It measures the average bid-ask spread using a volume-weighted methodology, accounting for the notional size of orders at the best bid and best ask and ensuring that periods with higher trading activity have a greater impact on the final metric. This approach provides a more accurate representation of implied transaction costs under active market conditions.
Calculation Methodology
- The bid-ask spread is calculated as the difference between the best bid and best ask prices and is expressed relative to the mid-point.
- Spreads are aggregated using a volume-weighted approach, where each observation is weighted by the corresponding traded volume. This ensures that periods with higher executed volume contribute more significantly to the average spread.
- The final value represents the average volume-weighted bid-ask spread across all tracked engagements for each market maker over the selected timeframe.
Below are the key inputs used to rank market makers on the Spread Leaderboard. Weightings are primarily driven by volume-weighted bid-ask spreads and the uptime to measure market makers' consistency of quoting.
| Metric | Weighting | Ranking |
|---|---|---|
| Volume-Weighted Bid-Ask Spread | 50.00% | 1 |
| Spread Uptime | 40.00% | 2 |
| Number of Projects | 10.00% | 3 |
Volume-weighted average bid-ask spreads ("VWAS") are calculated per market maker on a once-daily basis. Each trading pair's spread is weighted by its share of total daily fill volume, and those weighted spreads are summed to produce the VWAS. Venues with more volume therefore have a larger impact on the final number.
Take the following example where the MM is trading across 5 venues:
- Venue 1: $1.0m @ 5 bps
- Venue 2: $750k @ 10 bps
- Venue 3: $500k @ 10 bps
- Venue 4: $100k @ 50 bps
- Venue 5: $10k @ 100 bps
The total fill volume in this example is $2.36m, allowing us to calculate VWAS as:
VWAS = [(1.0m × 5) + (0.75m × 10) + (0.5m × 10) + (0.1m × 50) + (0.01m × 100)] / 2.36m ≈ 9.96 bps (~10 bps)
It's worth noting that even though Venue 5 has a very wide spread, its impact is minimal due to low volume, while the high-volume venues dominate the result.
How to Interpret
Lower bid-ask spreads indicate tighter pricing around the prevailing price, or the mid-point, reflecting more competitive quoting.
Because spreads are volume-weighted, the metric emphasizes pricing behavior during periods of meaningful trading activity. As a result, the leaderboard reflects effective spread performance under active market conditions rather than purely static quoting.
Comparisons across market makers should be made within the same selected timeframe to ensure consistency.
Filtering
By default, the Spread Leaderboard displays average notional values. Users can switch between percentile rankings and absolute rank positions.
Timeframe filtering can be configured under the "Refine" button at the top right of the table. All spread metrics are recalculated dynamically based on the selected timeframe.
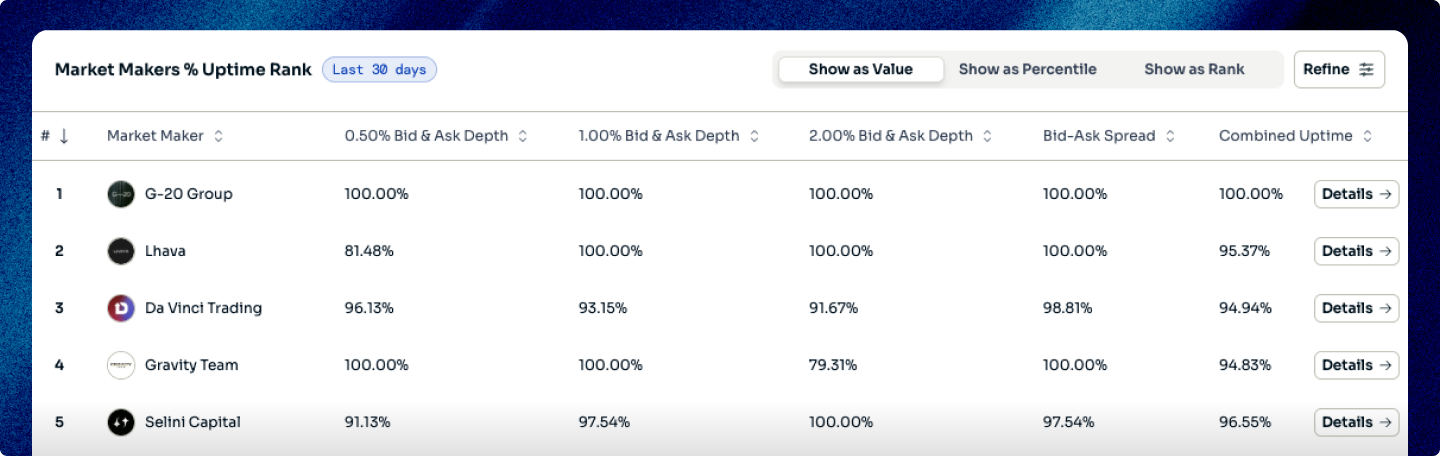
6. KPI Adherence Leaderboard
Overview
The KPI Adherence Leaderboard ranks market makers based on the consistency with which they meet predefined performance thresholds across their tracked engagements. It evaluates adherence to industry standard KPIs, including depth thresholds (+/- 0.50%, +/- 1.00%, & +/- 2.00%) and top-of-book spread requirements, using a daily binary pass/fail framework. These outcomes are aggregated over time to measure the proportion of successful KPI instances, providing a standardized view of operational consistency across market makers.
Calculation Methodology
KPI adherence is calculated on a monthly basis by evaluating daily performance against predefined thresholds for each KPI.
For each day and each KPI, a binary value is assigned:
1(pass) if the KPI is met0(fail) if the KPI is not met
These binary outcomes are aggregated across all days in the month and across all tracked engagements for each market maker.
The final KPI adherence value represents the proportion of "pass" instances relative to the total number of evaluated instances.
The table below outlines how KPI adherence is measured and ranked across market makers. The weighting reflects the relative importance of maintaining depth and spread requirements over time, based on daily pass/fail outcomes.
| Metric | Weighting | Ranking |
|---|---|---|
| Depth 200 bps, Uptime % | 30.00% | 1 |
| Volume-Weighted Bid-Ask Spread, Uptime % | 18.00% | 2 |
| Depth 100 bps, Uptime % | 17.00% | 3 |
| Depth 50 bps, Uptime % | 13.00% | 4 |
| Combined Uptime % | 12.00% | 5 |
| Projects Count | 10.00% | 6 |
How to Interpret
Higher KPI adherence indicates that a market maker consistently meets predefined performance thresholds across their engagements.
Because adherence is measured as a proportion of successful outcomes over time, the metric reflects reliability and consistency rather than magnitude of performance.
Lower adherence indicates more frequent deviations from required thresholds, even if other performance metrics (e.g., depth or volume) may be strong.
Comparisons across market makers should be made within the same selected timeframe to ensure consistency.
Filtering
By default, the KPI Adherence Leaderboard displays average notional values. Users can switch between percentile rankings and absolute rank positions.
Depth thresholds (+/- 0.50%, +/- 1.00%, & +/- 2.00%) can be selected to filter KPI adherence results based on the corresponding performance criteria.
Timeframe filtering can be configured under the "Refine" button at the top right of the table. All KPI adherence metrics are recalculated dynamically based on the selected timeframe.
7. Glossary
% of Market: A market maker's relative contribution to total depth or volume within a defined set of engagements or thresholds. Take the following example:
- Total Market Volume: $50M
- Market Maker Volume: $5M
- % of Market (Market Share) = 10%
+/- 0.50%, +/- 1.00%, & +/- 2.00%: Depth of liquidity thresholds measured from the midpoint between the best-bid and best-ask.
Active Engagements: Live market making mandates currently being tracked by Forgd across token projects.
Aggregate Depth: The total resting bid and ask liquidity within a defined percentage threshold.
Ancillary Trading Functions: Trading activities outside of core market making, including strategies or services that support liquidity, execution, or capital deployment.
Best Ask: The lowest price at which a market maker is willing to sell an asset, as a resting limit order.
Ask-Side Liquidity: Resting sell orders placed above the mid-point that contribute to the offer side of the order book.
Best Bid: The highest price at which a market maker is willing to buy an asset, as a resting limit order.
Bid-Ask Spread: The difference between the best bid and best ask, typically expressed as a percentage relative to the midpoint price.
Bid-Side Liquidity: Resting buy orders placed below the mid-point that contribute to the bid side of the order book.
Binary Outcome: A pass/fail result used to evaluate whether a KPI was met on a given day.
Capital Efficiency: How effectively a market maker deploys inventory to provide liquidity and participate in trades.
Centralized Exchange ("CEX"): A centralized trading venue where assets are traded through an order book managed by an operator.
Combined Uptime: The percentage of time a market maker simultaneously meets multiple KPI thresholds across depth and spreads.
Composite Score: The weighted output of 50+ KPIs and attributes used to rank market makers in the Performance Index.
Coverage & Capabilities: A measure of a market maker's presence across CEXs, DEXs, and additional trading functions beyond core market making.
Depth: The amount of resting bid and ask liquidity available within a defined range around the mid-point.
Depth Loan Utilization: The ratio of loaned inventory used to support quoted depth relative to total average depth provided. Take the following example:
- Loaned Inventory: $1M
- Average Daily Depth (+/- 2.00%): $250K
- Depth Loan Utilization = 25%
Decentralized Exchange ("DEX"): An on-chain trading venue where assets are traded without a centralized intermediary.
Executed Volume: Total trading activity attributed to a market maker, including both maker and taker fills.
Execution Quality: A measure of how effectively a market maker facilitates trades, typically reflected through volume, spreads, and consistency.
Implied Transaction Costs: The effective cost of trading derived from the bid-ask spread and available liquidity.
Integration Level: The degree to which a market maker is integrated with Forgd's data infrastructure and reporting systems.
Integrations: The number of direct connections a market maker maintains with exchanges, trading venues, or systems used for execution and data flow.
Inventory: The assets held by a market maker that are used to provide liquidity and facilitate trading.
Key Performance Indicator ("KPI"): A predefined metric used to evaluate a market maker's performance across depth, spreads, volume, or uptime.
KPI Adherence: The proportion of time a market maker meets predefined KPI thresholds, measured using a daily pass/fail framework. Take the following example:
- Evaluation Period: 30 days
- Days KPI Thresholds Met: 27
- Days KPI Thresholds Not Met: 3
- KPI Adherence = 27 / 30 = 90%
Loaned Inventory: Assets provided by a project to a market maker to support liquidity provision and trading activity.
Maker Fill Volume: Executed volume where trades occur against resting liquidity provided by the market maker.
Market Maker Leaderboard: Forgd's framework for ranking market makers across depth, volume, spreads, and KPI adherence using standardized metrics.
Market Turnover: The total amount of trading activity occurring over a given period.
Mid-Point: The price halfway between the best bid and best ask, used as the reference for measuring spreads and depth.
Normalized Metric: A metric expressed relative to a broader dataset, allowing for consistent comparison across market makers.
Notional Depth: The U.S. dollar value of resting bid and ask liquidity within a defined price threshold.
Order Book: The list of all resting bids and ask orders for a trading pair at a given point in time.
Passive Liquidity Provision: Providing resting orders on the order book that are filled by incoming market participants.
Percentile Ranking: A relative ranking that shows how a market maker compares to others as a percentage of the total distribution. Take the example below:
- Total Market Makers: 50
- Market Maker Rank: 10
- Percentile Ranking = 80th percentile (top 20%)
Performance Index: Forgd's composite ranking of market makers based on a weighted aggregation of 50+ performance and infrastructure metrics.
Performance Thresholds: Predefined levels for depth, spreads, or other KPIs that market makers are expected to meet.
Project Count: The number of active engagements a market maker has across tracked token projects.
Quote Competitiveness: How closely a market maker quotes around the mid-point, typically reflected through spread tightness.
Ranking: The ordered position of a market maker relative to peers based on a specific metric or composite score.
Resting Liquidity: Open bid and ask orders sitting on the order book that have not yet been executed.
Spread Leaderboard: The leaderboard that ranks market makers based on volume-weighted bid-ask spreads across their tracked engagements.
Spread Uptime: The percentage of time a market maker maintains spreads within predefined thresholds.
Taker Fill Volume: Executed volume where the market maker actively crosses the spread to trade against existing liquidity.
Top-of-Book: The best available bid and ask prices in the order book at a given point in time.
Total Volume: The sum of maker and taker fill volume generated by a market maker.
Tracked Engagements: Market making mandates where performance data is actively monitored and included in Forgd's datasets.
Trading Pair: A pair of assets traded against each other, typically consisting of a base asset and a quote asset.
Trust: A measure of the confidence Forgd can place in a market maker's observed performance, based on the number of tracked engagements and any trading abnormalities identified through Forgd's monitoring systems.
Uptime: The percentage of time a market maker meets predefined quoting or KPI thresholds.
Venue: A trading platform, such as a CEX or DEX, where market activity occurs.
Volume Leaderboard: The leaderboard that ranks market makers based on executed trading activity across maker and taker volume.
Volume Loan Utilization: The ratio of average executed volume to loaned inventory, reflecting trading activity relative to available capital.
- Loaned Inventory: $2M
- Average Daily Trade Volume: $1M
- Volume Loan Utilization: 50%
Volume-Weighted Bid-Ask Spread: The average bid-ask spread weighted by executed trading volume, giving greater influence to higher-activity periods.
Volume-Weighted Average Spread ("VWAS"): The aggregated spread metric calculated by weighting each trading pair's spread by its share of total volume across venues. Take the following example where the MM is trading across 5 venues:
- Venue 1: $1.0m @ 5 bps
- Venue 2: $750k @ 10 bps
- Venue 3: $500k @ 10 bps
- Venue 4: $100k @ 50 bps
- Venue 5: $10k @ 100 bps
The total fill volume in this example is $2.36m, allowing us to calculate VWAS as:
VWAS = [(1.0m × 5) + (0.75m × 10) + (0.5m × 10) + (0.1m × 50) + (0.01m × 100)] / 2.36m ≈ 9.96 bps (~10 bps)